Market Outlook
February 08, 2017
Market Cues
Domestic Indices
Chg (%)
(Pts)
(Close)
Indian markets are likely to start off on a flat note today tracking SGX nifty and
BSE Sensex
(0.4)
(104)
28,335
ahead of the RBI policy.
Nifty
(0.4)
(33)
8,768
The S&P 500 ended barely higher on Tuesday while the Nasdaq managed to scratch
Mid Cap
(0.2)
(24)
13,407
out a new record as gains in big tech names countered energy declines. The Dow
Small Cap
(0.1)
(12)
13,528
Jones Industrial Average also hit an intraday all-time high just after the market
opened, and the benchmark S&P 500 came close to yet another record high. The
Bankex
(0.2)
(40)
23,314
Dow Jones Industrial Average rose 0.19 percent to 20,090 while the S&P 500
gained 0.02 percent to 2,293.
Global Indices
Chg (%)
(Pts)
(Close)
The UK markets rose on Tuesday, boosted by a weak sterling. The FTSE 100 ended
Dow Jones
0.2
38
20,090
the session 0.2 percent higher at 7,186 points while the British mid cap index closed
Nasdaq
0.2
11
5,674
1 percent higher at a record closing level of 18,560 points. Shares of oil major BP
FTSE
0.2
14
7,186
were down more than 4% after the company said its 2016 profit slumped to the
Nikkei
(0.3)
(66)
18,911
lowest level in at least a decade, to $2.59 billion.
Hang Seng
(0.1)
(17)
23,332
In a climb-down from its four-month high, the Sensex on Tuesday took its first hit in
Shanghai Com
(0.1)
(4)
3,153
five sessions by falling over 104 points even as the Nifty slipped below the 8,800-
mark, weighed down by rate-sensitive banking, realty and other stocks ahead of the
Advances / Declines
BSE
NSE
Reserve Bank of India (RBI) monetary policy. BSE Sensex closed lower by 0.37% to
Advances
1,302
705
28,335, while the Nifty 50 fell 0.37% to 8,768 as doubts remain over RBI’s rate cut
hopes.
Declines
1,599
953
Unchanged
126
70
News Analysis
GSPL to supply gas to Maruti, Honda plants
Volumes (` Cr)
Detailed analysis on Pg2
BSE
3,387
Investor’s Ready Reckoner
NSE
24,005
Key Domestic & Global Indicators
Stock Watch: Latest investment recommendations on 150+ stocks
Net Inflows (` Cr)
Net
Mtd
Ytd
Refer Pg7 onwards
FII
604
1,399
1,352
MFs
(41)
911
6,126
Top Picks
CMP
Target
Upside
Company
Sector
Rating
(`)
(`)
(%)
Top Gainers
Price (`)
Chg (%)
Amara Raja Batteries Auto & Auto AncillaryAccumulate
887
1,009
13.8
Unitech
7
16.2
Alkem Laboratories
Pharmaceuticals
Accumulate
1,816
1,989
9.5
HCL Tech
IT
Buy
815
1,000
22.7
Amtekauto
39
11.2
Power Grid Corp.
Power
Accumulate
200
223
11.3
Fsl
43
9.0
Navkar Corp.
Others
Buy
175
265
51.6
Corpbank
53
7.7
More Top Picks on Pg5
Torntpower
209
6.1
Key Upcoming Events
Previous
Consensus
Date
Region
Event Description
Top Losers
Price (`)
Chg (%)
Reading
Expectations
Jubilant
704
(5.8)
Feb 08 India
RBI Repo rate
6.25
6.00
Feb 08 India
RBI Reserve Repo rate
5.75
5.50
Adanient
92
(5.3)
Feb 08 US
Initial Jobless claims
246.00
249.00
Jpassociat
13
(5.2)
Feb 09 India
RBI Cash Reserve Ratio
4.00
4.00
Ramcocem
681
(4.7)
Feb 10 India
Export YoY%
5.70
--
Redington
102
(4.5)
More Events on Pg6
As on February 07, 2017
Market Outlook
February 08, 2017
News Analysis
GSPL to supply gas to Maruti, Honda plants
Gujarat State Petronet Ltd (GSPL) has commissioned the Mandali-Becharaji
pipeline to supply natural gas for manufacturing at automobile majors Maruti
Suzuki India Ltd (MSIL) and Honda Motors Scooters India (HMSI) plants in north
Gujarat. The Honda project was commissioned in June
2016, while
commissioning of the Suzuki plant is due in March 2017.
The 12-inch diameter, 51-km-long gas pipeline between Mandali and Becharaji is
a branch of the Kalol-Mehsana main trunk line. From Becharaji, the company laid
a branch pipeline of nearly 100 meters for Maruti-Suzuki and 2.5 km to reach the
Honda plant at Vithalpur.
The Suzuki’s plant is its first wholly owned plant in India and has been set up with
an investment of `18,500cr. This plant will supply vehicles and components
exclusively to Maruti. Suzuki expects strong growth in its India operations which is
likely to benefit GSPL.
Economic and Political News
Govt confident that debit card charges may decline
Rupee to weaken to record low over the coming year
Govt has saved `49,500cr going to middlemen
Big monetary gain for Modi: Plugging LPG subsidy leaks leads to `21,000cr
savings
Corporate News
IDFC Bank buys 5% stake in IIFL Holdings for `502cr
With meagre `10k cr allocation, PSU banks are in for a tough time
For cement sector, recovery from demonetisation could be round the corner
SUUTI sells 2% stake in ITC
US visa curbs not likely to be 'retrospective': Hexaware
Government draws up plan to phase out old vehicles
Market Outlook
February 08, 2017
Quarterly Bloomberg Brokers Consensus Estimate
Hero MotoCorp Ltd - Feb 8, 2017
Particulars ( ` cr)
3QFY17E
3QFY16
y-o-y (%)
2QFY17
q-o-q (%)
Net sales
7,807
7,174
8.8
7,670
1.8
EBITDA
1,278
1,140
12.1
1,369
(6.6)
EBITDA margin (%)
16.4
15.9
17.8
Net profit
936
796
17.6
995
(5.9)
Bharat Forge Ltd - Feb 8, 2017
Particulars ( ` cr)
3QFY17E
3QFY16
y-o-y (%)
2QFY17
q-o-q (%)
Net sales
932
1,029
(9.5)
872
6.8
EBITDA
262
317
(17.4)
248
5.8
EBITDA margin (%)
28.1
30.8
28.4
Net profit
132
170
(22.7)
127
3.8
United Breweries Ltd - Feb 8, 2017
Particulars ( ` cr)
3QFY17E
3QFY16
y-o-y (%)
2QFY17
q-o-q (%)
Net sales
1,203
1,031
16.7
990
21.5
EBITDA
170
183
(7.5)
245
(30.7)
EBITDA margin (%)
14.1
17.8
24.7
Net profit
59
72
(17.6)
27
119.6
Reliance Power Ltd Consol - Feb 8, 2017
Particulars ( ` cr)
3QFY17E
3QFY16
y-o-y (%)
2QFY17
q-o-q (%)
Net sales
2,538
2,562
(0.9)
2,473
2.6
EBITDA
1,099
1,230
(10.6)
1,144
(4.0)
EBITDA margin (%)
43.3
48.0
46.3
Net profit
347
352
(1.5)
272
27.4
Tata Chemicals Ltd Consol - Feb 8, 2017
Particulars ( ` cr)
3QFY17E
3QFY16
y-o-y (%)
2QFY17
q-o-q (%)
Net sales
4,747
4,597
3.3
3,348
41.8
EBITDA
701
490
43.0
554
26.6
EBITDA margin (%)
14.8
10.7
16.5
Net profit
288
130
121.3
213
35.2
Union Bank of India - Feb 8, 2017
Particulars ( ` cr)
3QFY17E
3QFY16
y-o-y (%)
2QFY17
q-o-q (%)
Net profit
264
79
236.1
177
49.4
Market Outlook
February 08, 2017
NTPC Ltd - Feb 8, 2017
Particulars ( ` cr)
3QFY17E
3QFY16
y-o-y (%)
2QFY17
q-o-q (%)
Net sales
18,191
17,318
5.0
19,398
(6.2)
EBITDA
5,025
4,624
8.7
5391
(6.8)
EBITDA margin (%)
27.6
26.7
27.8
Net profit
2,302
2,493
(7.7)
2496
(7.8)
Cipla Ltd - Feb 8, 2017
Particulars ( ` cr)
3QFY17E
3QFY16
y-o-y (%)
2QFY17
q-o-q (%)
Net sales
3735
3107
20.2
3751
(0.4)
EBITDA
694
454
52.9
681
1.9
EBITDA margin (%)
18.6
14.6
18.2
Net profit
364
343
6.1
354
2.8
Siemens Ltd - Feb 8, 2017
Particulars ( ` cr)
3QFY17E
3QFY16
y-o-y (%)
2QFY17
q-o-q (%)
Net sales
2351
2314
1.6
3091
(23.9)
EBITDA
201
194
3.6
206
(2.4)
EBITDA margin (%)
8.5
8.3
Net profit
122
114
7.0
2467
(95.1)
Market Outlook
February 08, 2017
Top Picks ★★★★★
Large Cap
Market Cap
CMP
Target
Upside
Company
Rationale
(` Cr)
(`)
(`)
(%)
To outpace battery industry growth due to better
Amara Raja Batteries
15,149
887
1,009
13.8
technological products leading to market share gains in both
the automotive OEM and replacement segments.
Strong growth in domestic business due to its leadership in
Alkem Laboratories
21,713
1,816
1,989
9.5
acute therapeutic segment. Alkem expects to launch more
products in USA, which bodes for its international business.
The stock is trading at attractive valuations and is factoring
HCL Tech
1,14,977
815
1,000
22.7
all the bad news.
Back on the growth trend, expect a long term growth of 14%
Infosys
2,17,004
945
1,249
32.2
to be a US$20bn in FY2020.
Strong order backlog and improvement in execution would
Larsen & Toubro
1,39,906
1,500
1,634
8.9
trigger the growth for the L&T
One of the largest pharma companies with strong
Lupin
66,285
1,468
1,809
23.2
international presence. It has a rich pipeline of ANDAs which
is also one of the largest among the generic companies.
Going forward, we expect the company to report strong top-
Power Grid Corporation
1,04,815
200
223
11.3
line CAGR of ~16% and bottom-line CAGR of ~19% over
FY16-18 on back of strong capitalization guidance
Source: Company, Angel Research
Mid Cap
Market Cap
CMP
Target
Upside
Company
Rationale
(` Cr)
(`)
(`)
(%)
We expect the company would report strong profitability
Asian Granito
823
273
351
28.4
owing to better product mix, higher B2C sales and
amalgamation synergy.
Among the top 4 players in the consumer durables segment.
Bajaj Electricals
2,531
250
274
9.5
Improved profitability backed by turn around in E&P segment.
Strong order book lends earnings visibility.
Favourable outlook for the AC industry to augur well for
Cooling products business which is out pacing the market
Blue Star
5,177
542
634
17.0
growth. EMPPAC division's profitability to improve once
operating environment turns around.
With a focus on the low and medium income (LMI) consumer
Dewan Housing Finance
9,286
297
350
18.0
segment, the company has increased its presence in tier-II &
III cities where the growth opportunity is immense.
Strong loan growth backed by diversified loan portfolio and
Equitas Holdings
6,042
180
235
30.4
adequate CAR. ROE & ROA likely to remain decent as risk of
dilution remains low. Attractive valuations considering growth.
Economic recovery to have favourable impact on advertising
& circulation revenue growth. Further, the acquisition of a
Jagran Prakashan
6,149
188
225
19.6
radio business (Radio City) would also boost the company's
revenue growth.
High order book execution in EPC segment, rising B2C sales
KEI Industries
1,319
170
207
22.1
and higher exports to boost the revenues and profitability
Speedier execution and speedier sales, strong revenue visibilty
Mahindra Lifespace
1,446
352
522
48.1
in short-to-long run, attractive valuations
Higher growth in domestic branded sales and healthy export
Mirza International
1,130
94
107
14.0
to boost the profitability.
Massive capacity expansion along with rail advantage at ICD
Navkar Corporation
2,494
175
265
51.6
as well CFS augurs well for the company
Strong brands and distribution network would boost growth
Siyaram Silk Mills
1,507
1,608
1,720
7.0
going ahead. Stock currently trades at an inexpensive
valuation.
Market leadership in Hindi news genre and no. 2 viewership
ranking in English news genre, exit from the radio business,
TV Today Network
1,626
273
385
41.3
and anticipated growth in ad spends by corporates to benefit
the stock.
Source: Company, Angel Research
Market Outlook
February 08, 2017
Key Upcoming Events
Result Calendar
Date
Company
Hero Motocorp, Bharat Forge, Siemens, Thermax, Union Bank, Indraprasth Gas, Goodyear, Elecon Engineering,
Feb 8, 2017
Cipla, NTPC, Reliance Power, Competent Automobiles, Coffee Day Enterprises Ltd
JK Tyre, ABB, Jyoti Structures, Bank of India, Andhra Bank, SAIL, Cairn India, BPCL, Page Industries, Bajaj Electrical,
Feb 9, 2017
Styrolution, Lupin, Aurobindo Pharma, Power Grid Corpn, GIPCL
M&M, Bosch India, Crompton Greaves, Suzlon Energy, St Bk of India, Bank of Baroda, Reliance Capital, Corporation
Feb 10, 2017
Bank, Dena Bank, Sun TV Network, Jagran Prakashan, Hind. Zinc, Bhushan Steel, GAIL, Tide Water Oil India, Ipca
labs, Tata Power Co., CESC, Anant Raj, Radico Khaitan
Feb 11, 2017
Mangalam Cement, Coal India, Sarda Energy, TVS Srichakra, Sterling Tools, GSK Pharma
Feb 12, 2017
PTC India
Source: Bloomberg, Angel Research
Global economic events release calendar
Date
Time
Country
Event Description
Unit
Period
Bloomberg Data
Last Reported Estimated
Feb 8, 2017
2:30PM
India
RBI Reverse Repo rate
%
Feb 8
5.75
5.50
2:30PM
India
RBI Repo rate
%
Feb 8
6.25
6.00
7:00PM
US
Initial Jobless claims
Thousands
Feb 4
246.00
249.00
Feb 9, 2017
2:30PM
India
RBI Cash Reserve ratio
%
Feb 8
4.00
4.00
Feb 10, 2017
3:00PM
UK
Industrial Production (YoY)
% Change
Dec
2.00
3.20
India
Exports YoY%
% Change
Jan
5.70
--
China
Exports YoY%
% Change
Jan
(6.20)
3.00
India
Imports YoY%
% Change
Jan
0.50
--
5:30PM
India
Industrial Production YoY
% Change
Dec
5.70
1.20
Feb 14, 2017
3:30PM
Euro Zone
Euro-Zone GDP s.a. (QoQ)
% Change
4Q P
0.50
--
7:00AM
China
Consumer Price Index (YoY)
% Change
Jan
2.10
2.40
12:00PM
India
Monthly Wholesale Prices YoY%
% Change
Jan
3.39
4.20
3:00PM
UK
CPI (YoY)
% Change
Jan
1.60
--
US
Producer Price Index (mom)
% Change
Jan
0.80
--
12:30PM
Germany
GDP nsa (YoY)
% Change
4Q P
1.50
--
Feb 15, 2017
3:00PM
UK
Jobless claims change
% Change
Jan
(10.10)
--
7:45PM
US
Industrial Production
%
Jan
0.83
--
7:00PM
US
Housing Starts
Thousands
Jan
1,226.00
1,228.00
Feb 16, 2017
7:00PM
US
Consumer price index (mom)
% Change
Jan
0.30
0.30
7:00PM
US
Building permits
Thousands
Jan
1,228.00
1,230.00
Feb 20, 2017
8:30PM
Euro Zone
Euro-Zone Consumer Confidence
Value
Feb A
(4.90)
--
Feb 21, 2017
2:00PM
Germany
PMI Services
Value
Feb P
53.40
--
2:00PM
Germany
PMI Manufacturing
Value
Feb P
56.40
--
Feb 22, 2017
3:30PM
Euro Zone
Euro-Zone CPI (YoY)
%
Jan F
1.80
--
8:30PM
US
Existing home sales
Million
Jan
5.49
5.55
3:00PM
UK
GDP (YoY)
% Change
4Q P
2.20
--
Feb 24, 2017
8:30PM
US
New home sales
Thousands
Jan
536.00
570.00
Feb 28, 2017
7:00PM
US
GDP Qoq (Annualised)
% Change
4Q S
1.90
--
2:25PM
Germany
Unemployment change (000's)
Thousands
Feb
(26.00)
--
Source: Bloomberg, Angel Research
Market Outlook
February 08, 2017
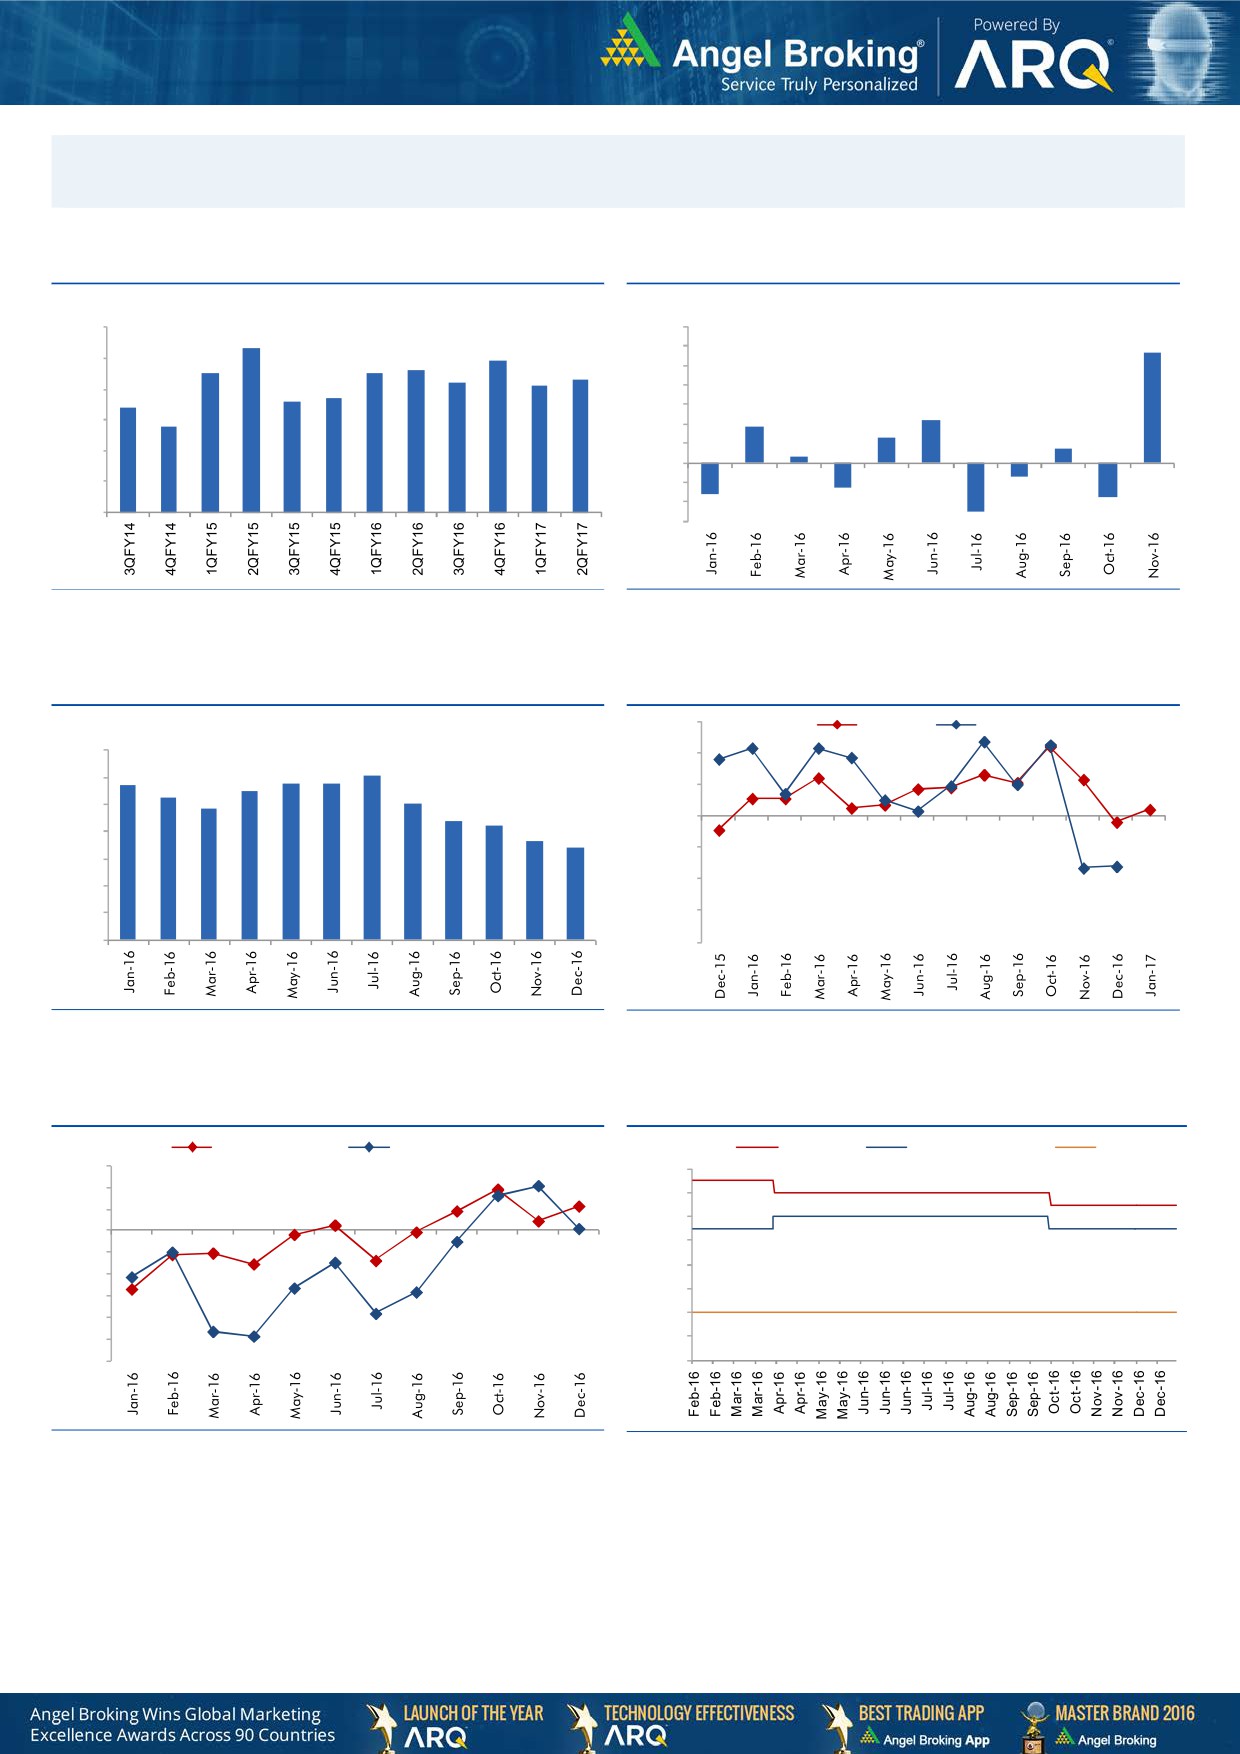
Macro watch
Exhibit 1: Quarterly GDP trends
Exhibit 2: IIP trends
(%)
(%)
9.0
7.0
8.3
5.7
7.9
6.0
8.0
7.5
7.5
7.6
7.2
7.1
7.3
5.0
6.6
6.7
4.0
7.0
6.4
3.0
2.2
5.8
1.9
6.0
2.0
1.3
0.7
1.0
0.3
5.0
-
4.0
(1.0)
(0.7)
(2.0)
3.0
(1.6)
(1.3)
(3.0)
(1.8)
(2.5)
Source: CSO, Angel Research
Source: MOSPI, Angel Research
Exhibit 3: Monthly CPI inflation trends
Exhibit 4: Manufacturing and services PMI
56.0
Mfg. PMI
Services PMI
(%)
7.0
54.0
6.1
5.7
5.8
5.8
6.0
5.3
5.5
5.1
52.0
4.8
5.0
4.4
4.2
50.0
3.6
4.0
3.4
48.0
3.0
46.0
2.0
1.0
44.0
-
42.0
Source: MOSPI, Angel Research
Source: Market, Angel Research; Note: Level above 50 indicates expansion
Exhibit 5: Exports and imports growth trends
Exhibit 6: Key policy rates
(%)
Exports yoy growth
Imports yoy growth
(%)
Repo rate
Reverse Repo rate
CRR
15.0
7.00
10.0
6.50
5.0
6.00
0.0
5.50
(5.0)
5.00
(10.0)
4.50
(15.0)
4.00
(20.0)
(25.0)
3.50
(30.0)
3.00
Source: Bloomberg, Angel Research
Source: RBI, Angel Research
Market Outlook
February 08, 2017
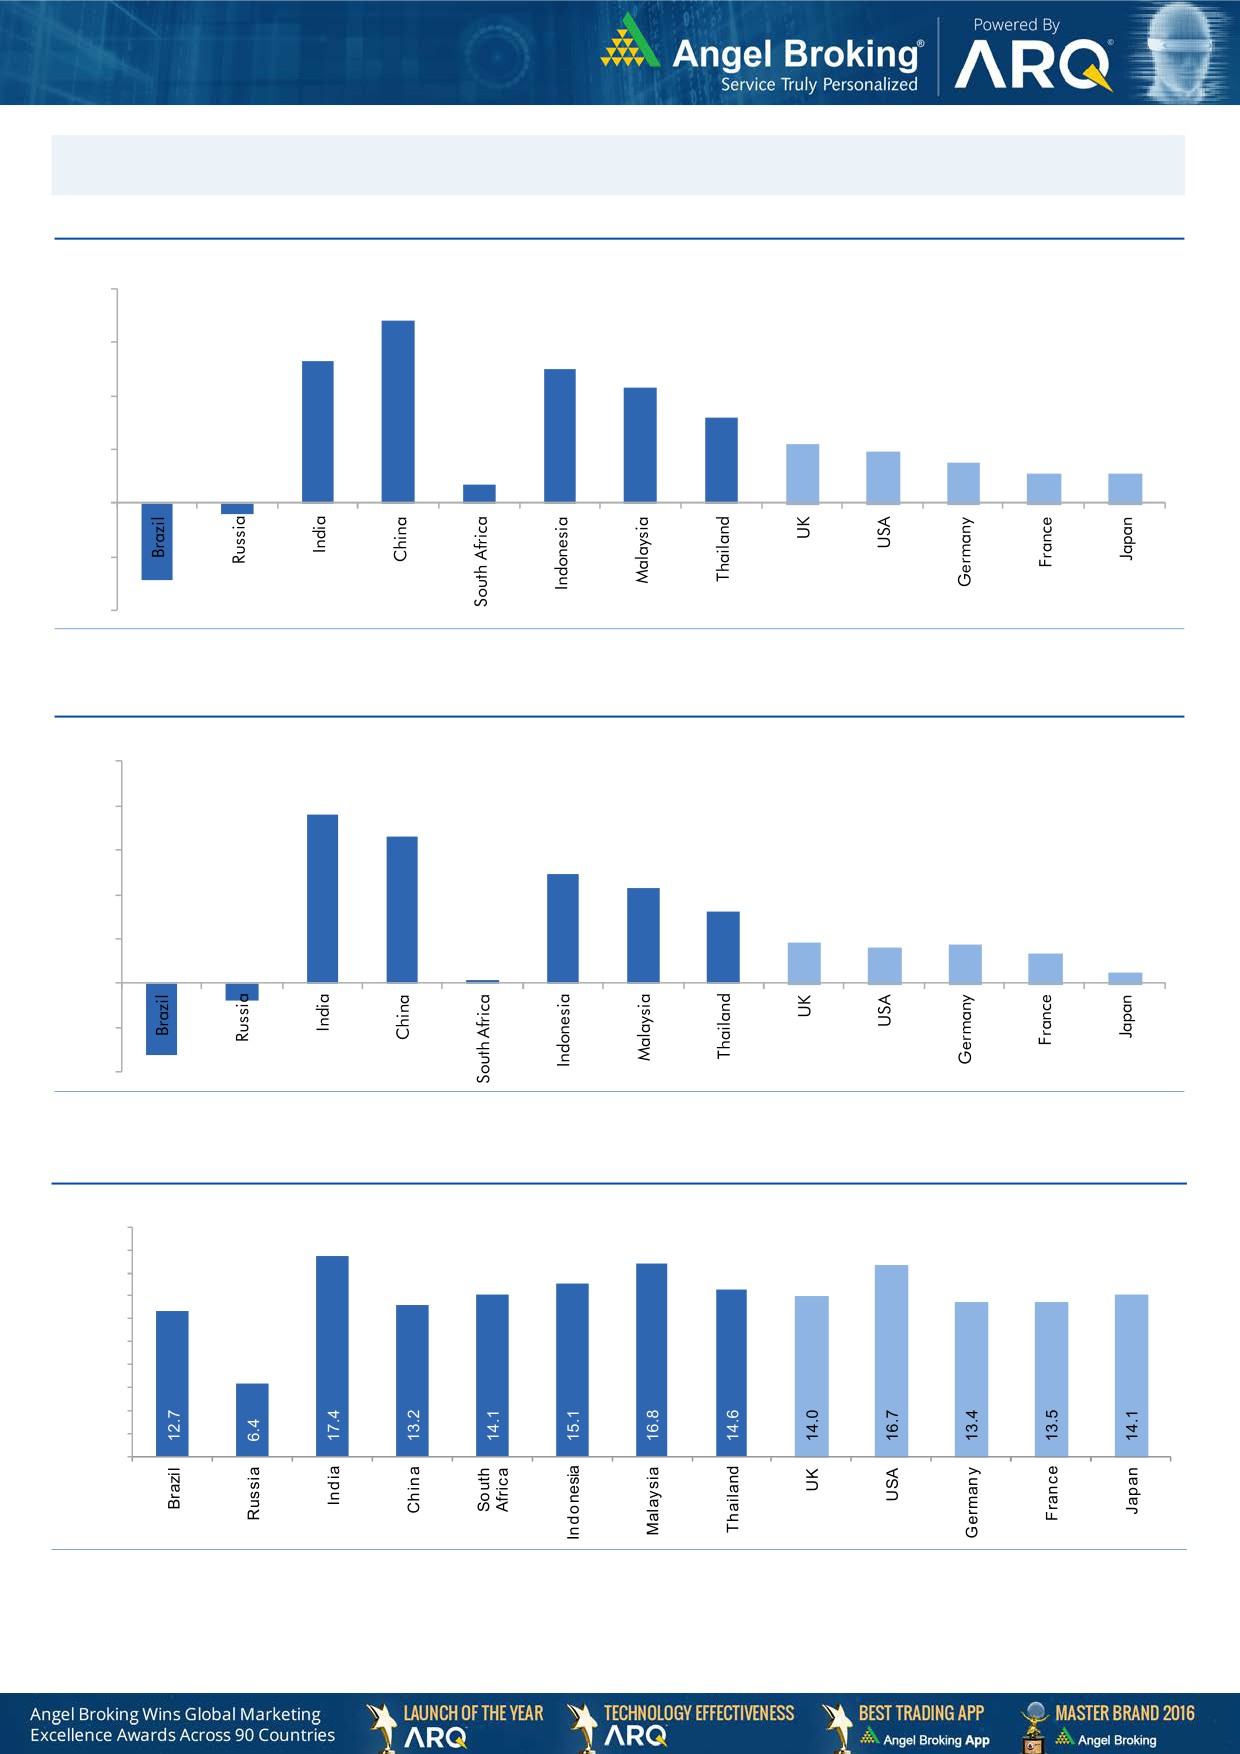
Global watch
Exhibit 1: Latest quarterly GDP Growth (%, yoy) across select developing and developed countries
(%)
8.0
6.8
5.3
6.0
5.0
0.7
4.3
4.0
3.2
2.2
1.9
2.0
1.5
1.1
1.1
-
(2.0)
(0.4)
(2.9)
(4.0)
Source: Bloomberg, Angel Research
Exhibit 2: 2016 GDP Growth projection by IMF (%, yoy) across select developing and developed countries
(%)
10.0
7.6
8.0
6.6
6.0
4.9
4.3
4.0
3.2
1.8
1.6
1.7
2.0
1.3
(0.8)
0.5
(3.3)
0.1
-
(2.0)
(4.0)
Source: IMF, Angel Research
Exhibit 3: One year forward P-E ratio across select developing and developed countries
(x)
20.0
18.0
16.0
14.0
12.0
10.0
8.0
6.0
4.0
2.0
-
Source: IMF, Angel Research
Market Outlook
February 08, 2017
Exhibit 4: Relative performance of indices across globe
Returns (%)
Country
Name of index
Closing price
1M
3M
1YR
Brazil
Bovespa
64,199
5.1
2.6
64.1
Russia
Micex
2,219
(1.6)
13.4
27.7
India
Nifty
8,768
6.7
3.0
15.6
China
Shanghai Composite
3,153
0.8
1.2
4.4
South Africa
Top 40
45,367
3.3
2.2
5.7
Mexico
Mexbol
46,729
1.4
1.2
11.4
Indonesia
LQ45
897
0.1
(3.4)
12.4
Malaysia
KLCI
1,689
2.5
1.8
1.3
Thailand
SET 50
991
1.0
5.1
24.8
USA
Dow Jones
20,090
1.0
11.3
23.9
UK
FTSE
7,186
(0.3)
7.4
26.7
Japan
Nikkei
18,911
(3.1)
8.4
11.0
Germany
DAX
11,549
0.6
13.6
33.1
France
CAC
4,754
(1.5)
10.2
17.3
Source: Bloomberg, Angel Research
Stock Watch
February 08, 2017
Company Name
Reco
CMP
Target
Mkt Cap
Sales ( Čcr )
OPM(%)
EPS (Č)
PER(x)
P/BV(x)
RoE(%)
EV/Sales(x)
(Č)
Price ( Č)
( Č cr )
FY17E FY18E
FY17E
FY18E
FY17E
FY18E
FY17E
FY18E
FY17E
FY18E
FY17E
FY18E
FY17E
FY18E
Agri / Agri Chemical
Rallis
Neutral
240
-
4,671
1,937
2,164
13.3
14.3
9.0
11.0
26.7
21.8
4.7
4.1
18.4
19.8
2.5
2.2
United Phosphorus
Neutral
728
-
36,906
15,176
17,604
18.5
18.5
37.4
44.6
19.5
16.3
3.8
3.2
21.4
21.2
2.5
2.1
Auto & Auto Ancillary
Ashok Leyland
Buy
94
111
26,780
22,407
26,022
10.6
10.6
5.2
6.4
18.0
14.7
4.1
3.4
23.6
24.7
1.3
1.1
Bajaj Auto
Neutral
2,775
-
80,299
25,093
27,891
19.5
19.2
143.9
162.5
19.3
17.1
5.4
4.7
30.3
29.4
2.9
2.6
Bharat Forge
Neutral
981
-
22,831
7,726
8,713
20.5
21.2
35.3
42.7
27.8
23.0
5.1
4.6
18.9
20.1
3.0
2.6
Eicher Motors
Neutral
23,784
-
64,701
16,583
20,447
17.5
18.0
598.0
745.2
39.8
31.9
13.6
10.4
41.2
38.3
3.7
3.0
Gabriel India
Accumulate
115
130
1,654
1,544
1,715
9.0
9.3
5.4
6.3
21.3
18.3
4.0
3.6
18.9
19.5
1.0
0.9
Hero Motocorp
Accumulate
3,259
3,541
65,074
30,958
34,139
15.7
15.7
193.6
208.3
16.8
15.6
6.6
5.4
34.2
30.5
2.0
1.7
Jamna Auto Industries Neutral
194
-
1,545
1,486
1,620
9.8
9.9
15.0
17.2
12.9
11.3
2.8
2.4
21.8
21.3
1.1
1.0
L G Balakrishnan & Bros Neutral
562
-
882
1,302
1,432
11.6
11.9
43.7
53.0
12.9
10.6
1.8
1.7
13.8
14.2
0.8
0.7
Mahindra and Mahindra Neutral
1,259
-
78,174
46,534
53,077
11.6
11.7
67.3
78.1
18.7
16.1
3.0
2.7
15.4
15.8
1.7
1.4
Maruti
Accumulate
6,206
6,560
187,468
67,822
83,288
16.0
16.4
253.8
312.4
24.5
19.9
5.6
4.6
23.0
22.9
2.4
1.9
Minda Industries
Neutral
381
-
3,020
2,728
3,042
9.0
9.1
68.2
86.2
5.6
4.4
1.3
1.0
23.8
24.3
1.2
1.0
Motherson Sumi
Neutral
337
-
47,358
45,896
53,687
7.8
8.3
13.0
16.1
25.9
21.0
8.3
6.7
34.7
35.4
1.1
0.9
Rane Brake Lining
Neutral
983
-
778
511
562
11.3
11.5
28.1
30.9
35.0
31.8
5.3
4.9
15.3
15.0
1.7
1.5
Setco Automotive
Neutral
37
-
494
741
837
13.0
13.0
15.2
17.0
2.4
2.2
0.4
0.4
15.8
16.3
1.1
1.0
Tata Motors
Neutral
507
-
146,324
300,209
338,549
8.9
8.4
42.7
54.3
11.9
9.3
1.9
1.6
15.6
17.2
0.6
0.5
TVS Motor
Neutral
392
-
18,628
13,390
15,948
6.9
7.1
12.8
16.5
30.7
23.7
7.6
6.1
26.3
27.2
1.4
1.2
Amara Raja Batteries
Accumulate
887
1,009
15,149
5,305
6,100
16.0
16.3
28.4
34.0
31.2
26.1
6.0
5.0
19.3
19.3
2.9
2.5
Exide Industries
Neutral
208
-
17,659
7,439
8,307
15.0
15.0
8.1
9.3
25.7
22.3
3.6
3.2
14.3
16.7
2.0
1.8
Apollo Tyres
Buy
182
235
9,280
12,877
14,504
14.3
13.9
21.4
23.0
8.5
7.9
1.3
1.2
16.4
15.2
0.9
0.8
Ceat
Buy
1,147
1,450
4,641
7,524
8,624
13.0
12.7
131.1
144.3
8.8
8.0
1.6
1.4
19.8
18.6
0.7
0.6
JK Tyres
Neutral
118
-
2,680
7,455
8,056
15.0
15.0
21.8
24.5
5.4
4.8
1.1
0.9
22.8
21.3
0.5
0.4
Swaraj Engines
Neutral
1,400
-
1,739
660
810
15.2
16.4
54.5
72.8
25.7
19.2
8.0
7.3
31.5
39.2
2.5
2.0
Subros
Neutral
187
-
1,119
1,488
1,681
11.7
11.9
6.4
7.2
29.2
26.0
3.1
2.8
10.8
11.4
1.0
0.9
Indag Rubber
Neutral
178
-
466
286
326
19.8
16.8
11.7
13.3
15.2
13.3
2.6
2.4
17.8
17.1
1.3
1.1
Capital Goods
ACE
Neutral
54
-
532
709
814
4.1
4.6
1.4
2.1
38.4
25.6
1.6
1.5
4.4
6.0
0.9
0.8
BEML
Neutral
1,263
-
5,259
3,451
4,055
6.3
9.2
31.4
57.9
40.2
21.8
2.4
2.2
6.3
10.9
1.6
1.4
Bharat Electronics
Neutral
1,565
-
34,957
8,137
9,169
16.8
17.2
58.7
62.5
26.7
25.0
4.1
3.7
44.6
46.3
3.3
2.9
Stock Watch
February 08, 2017
Company Name
Reco
CMP
Target
Mkt Cap
Sales ( Čcr )
OPM(%)
EPS (Č)
PER(x)
P/BV(x)
RoE(%)
EV/Sales(x)
(Č)
Price ( Č)
( Č cr )
FY17E
FY18E
FY17E
FY18E
FY17E
FY18E
FY17E
FY18E
FY17E
FY18E
FY17E
FY18E
FY17E
FY18E
Capital Goods
Voltas
Buy
331
407
10,962
6,511
7,514
7.9
8.7
12.9
16.3
25.7
20.3
4.6
4.1
16.7
18.5
1.4
1.2
BGR Energy
Neutral
141
-
1,020
16,567
33,848
6.0
5.6
7.8
5.9
18.1
24.0
1.0
1.0
4.7
4.2
0.2
0.1
BHEL
Neutral
152
-
37,179
28,797
34,742
-
2.8
2.3
6.9
66.0
22.0
1.1
1.1
1.3
4.8
0.9
0.7
Blue Star
Buy
542
634
5,177
4,283
5,077
5.9
7.3
14.9
22.1
36.4
24.5
7.1
6.0
20.4
26.4
1.3
1.1
Crompton Greaves
Neutral
72
-
4,503
5,777
6,120
5.9
7.0
3.3
4.5
21.8
16.0
1.0
0.9
4.4
5.9
0.7
0.6
Greaves Cotton
Neutral
140
-
3,427
1,755
1,881
16.8
16.9
7.8
8.5
18.0
16.5
3.6
3.3
20.6
20.9
1.6
1.5
Inox Wind
Neutral
184
-
4,079
5,605
6,267
15.7
16.4
24.8
30.0
7.4
6.1
2.1
1.5
25.9
24.4
0.8
0.6
KEC International
Neutral
154
-
3,957
9,294
10,186
7.9
8.1
9.9
11.9
15.6
12.9
2.3
2.0
15.6
16.3
0.7
0.6
KEI Industries
Buy
170
207
1,319
2,682
3,058
10.4
10.0
11.7
12.8
14.4
13.2
2.9
2.4
20.1
18.2
0.7
0.6
Thermax
Neutral
864
-
10,293
5,421
5,940
7.3
7.3
25.7
30.2
33.6
28.6
4.1
3.7
12.2
13.1
1.8
1.6
VATech Wabag
Buy
490
681
2,672
3,136
3,845
8.9
9.1
26.0
35.9
18.8
13.6
2.4
2.0
13.4
15.9
0.8
0.6
Cement
ACC
Neutral
1,456
-
27,335
11,225
13,172
13.2
16.9
44.5
75.5
32.7
19.3
3.1
2.9
11.2
14.2
2.4
2.1
Ambuja Cements
Neutral
235
-
46,623
9,350
10,979
18.2
22.5
5.8
9.5
40.5
24.7
3.4
3.1
10.2
12.5
5.0
4.3
India Cements
Neutral
165
-
5,053
4,364
4,997
18.5
19.2
7.9
11.3
20.8
14.6
1.5
1.5
8.0
8.5
1.9
1.7
JK Cement
Neutral
788
-
5,511
4,398
5,173
15.5
17.5
31.2
55.5
25.3
14.2
3.0
2.6
12.0
15.5
1.8
1.5
J K Lakshmi Cement
Buy
393
565
4,626
2,913
3,412
14.5
19.5
7.5
22.5
52.4
17.5
3.2
2.7
12.5
18.0
2.2
1.8
Orient Cement
Buy
136
215
2,786
2,114
2,558
18.5
20.5
8.1
11.3
16.8
12.0
2.5
2.1
9.0
14.0
1.9
1.5
UltraTech Cement
Neutral
3,703
-
101,647
25,768
30,385
21.0
23.5
111.0
160.0
33.4
23.2
4.3
3.7
13.5
15.8
4.0
3.4
Construction
ITNL
Neutral
108
-
3,543
8,946
10,017
31.0
31.6
8.1
9.1
13.3
11.8
0.5
0.5
4.2
5.0
3.7
3.5
KNR Constructions
Neutral
186
-
2,620
1,385
1,673
14.7
14.0
41.2
48.5
4.5
3.8
0.8
0.7
14.9
15.2
2.0
1.6
Larsen & Toubro
Accumulate
1,500
1,634
139,906
111,017
124,908
11.0
11.0
61.1
66.7
24.6
22.5
3.0
2.7
13.1
12.9
2.3
2.1
Gujarat Pipavav Port
Neutral
160
-
7,754
705
788
52.2
51.7
5.0
5.6
32.1
28.6
3.2
2.8
11.2
11.2
10.7
9.0
Nagarjuna Const.
Neutral
86
-
4,798
8,842
9,775
9.1
8.8
5.3
6.4
16.3
13.5
1.3
1.2
8.2
9.1
0.7
0.6
PNC Infratech
Buy
106
143
2,708
2,350
2,904
13.1
13.2
9.0
8.8
11.7
12.0
0.4
0.4
15.9
13.9
1.3
1.0
Simplex Infra
Neutral
304
-
1,504
6,829
7,954
10.5
10.5
31.4
37.4
9.7
8.1
1.0
0.9
9.9
13.4
0.6
0.5
Power Mech Projects
Neutral
459
-
675
1,801
2,219
12.7
14.6
72.1
113.9
6.4
4.0
1.2
1.0
16.8
11.9
0.4
0.3
Sadbhav Engineering
Accumulate
277
298
4,745
3,598
4,140
10.3
10.6
9.0
11.9
30.7
23.2
3.2
2.8
9.9
11.9
1.6
1.4
NBCC
Neutral
278
-
16,695
7,428
9,549
7.9
8.6
8.2
11.0
33.9
25.3
1.7
1.3
28.2
28.7
2.0
1.5
MEP Infra
Neutral
42
-
683
1,877
1,943
30.6
29.8
3.0
4.2
14.0
10.0
6.8
4.6
0.6
0.6
1.7
1.6
Stock Watch
February 08, 2017
Company Name
Reco
CMP
Target
Mkt Cap
Sales ( Čcr )
OPM(%)
EPS (Č)
PER(x)
P/BV(x)
RoE(%)
EV/Sales(x)
(Č)
Price ( Č)
( Č cr )
FY17E
FY18E
FY17E
FY18E
FY17E
FY18E
FY17E
FY18E
FY17E
FY18E
FY17E
FY18E
FY17E
FY18E
Construction
SIPL
Neutral
103
-
3,633
1,036
1,252
65.5
66.2
(8.4)
(5.6)
3.9
4.4
(22.8)
(15.9)
11.7
9.8
Engineers India
Neutral
150
-
10,118
1,725
1,935
16.0
19.1
11.4
13.9
13.2
10.8
1.8
1.8
13.4
15.3
4.8
4.3
Financials
Axis Bank
Buy
493
580
117,805
46,932
53,575
3.5
3.4
32.4
44.6
15.2
11.0
2.0
1.7
13.6
16.5
-
-
Bank of Baroda
Neutral
187
-
43,157
19,980
23,178
1.8
1.8
11.5
17.3
16.3
10.8
1.9
1.5
8.3
10.1
-
-
Canara Bank
Neutral
312
-
16,917
15,225
16,836
1.8
1.8
14.5
28.0
21.5
11.1
1.5
1.2
5.8
8.5
-
-
Can Fin Homes
Neutral
2,042
-
5,435
420
526
3.5
3.5
86.5
107.8
23.6
18.9
5.1
4.2
23.6
24.1
-
-
Cholamandalam Inv. &
Buy
1,053
1,230
16,451
2,012
2,317
6.3
6.3
42.7
53.6
24.7
19.6
3.9
3.3
16.9
18.3
-
-
Fin. Co.
Dewan Housing Finance Buy
297
350
9,286
2,225
2,688
2.9
2.9
29.7
34.6
10.0
8.6
1.6
1.4
16.1
16.8
-
-
Equitas Holdings
Buy
180
235
6,042
939
1,281
11.7
11.5
5.8
8.2
31.1
22.0
2.7
2.4
10.9
11.5
-
-
Federal Bank
Neutral
83
-
14,264
8,259
8,995
3.0
3.0
4.3
5.6
19.3
14.8
1.6
1.5
8.5
10.1
-
-
HDFC
Neutral
1,406
-
222,797
11,475
13,450
3.4
3.4
45.3
52.5
31.0
26.8
6.0
5.3
20.2
20.5
-
-
HDFC Bank
Accumulate
1,307
1,375
333,792
46,097
55,433
4.5
4.5
58.4
68.0
22.4
19.2
3.9
3.3
18.8
18.6
-
-
ICICI Bank
Accumulate
288
315
167,550
42,800
44,686
3.1
3.3
18.0
21.9
16.0
13.1
2.2
2.0
11.1
12.3
-
-
Lakshmi Vilas Bank
Buy
145
174
2,776
3,339
3,799
2.7
2.8
11.0
14.0
13.2
10.4
1.4
1.3
11.2
12.7
-
-
LIC Housing Finance
Accumulate
555
630
27,994
3,712
4,293
2.6
2.5
39.0
46.0
14.2
12.1
2.7
2.3
19.9
20.1
-
-
Punjab Natl.Bank
Neutral
152
-
32,303
23,532
23,595
2.3
2.4
6.8
12.6
22.3
12.1
3.5
2.5
3.3
6.5
-
-
RBL Bank
Neutral
393
-
14,528
1,783
2,309
2.6
2.6
12.7
16.4
30.9
24.0
3.4
3.0
12.8
13.3
-
-
South Ind.Bank
Neutral
23
-
3,129
6,435
7,578
2.5
2.5
2.7
3.1
8.6
7.5
1.1
0.9
10.1
11.2
-
-
St Bk of India
Neutral
278
-
221,265
88,650
98,335
2.6
2.6
13.5
18.8
20.6
14.8
2.0
1.7
7.0
8.5
-
-
Union Bank
Neutral
169
-
11,594
13,450
14,925
2.3
2.3
25.5
34.5
6.6
4.9
1.0
0.8
7.5
10.2
-
-
Yes Bank
Neutral
1,397
-
59,071
8,978
11,281
3.3
3.4
74.0
90.0
18.9
15.5
3.6
3.0
17.0
17.2
-
-
FMCG
Asian Paints
Neutral
997
-
95,613
17,128
18,978
16.8
16.4
19.1
20.7
52.2
48.2
18.2
17.1
34.8
35.5
5.5
5.0
Britannia
Accumulate
3,225
3,626
38,705
9,594
11,011
14.6
14.9
80.3
94.0
40.2
34.3
16.5
12.8
41.2
-
3.9
3.3
Colgate
Accumulate
894
995
24,318
4,605
5,149
23.4
23.4
23.8
26.9
37.6
33.2
20.8
16.3
64.8
66.8
5.2
4.6
Dabur India
Accumulate
266
304
46,936
8,315
9,405
19.8
20.7
8.1
9.2
32.9
29.0
9.2
7.6
31.6
31.0
5.3
4.7
GlaxoSmith Con*
Neutral
5,076
-
21,346
4,350
4,823
21.2
21.4
179.2
196.5
28.3
25.8
7.5
6.4
27.1
26.8
4.3
3.8
Godrej Consumer
Neutral
1,577
-
53,696
10,235
11,428
18.4
18.6
41.1
44.2
38.4
35.7
8.5
7.2
24.9
24.8
5.3
4.7
HUL
Neutral
855
-
185,035
35,252
38,495
17.8
17.8
20.7
22.4
41.4
38.2
39.6
33.9
95.6
88.9
5.1
4.7
ITC
Neutral
277
-
335,883
40,059
44,439
38.3
39.2
9.0
10.1
30.9
27.3
8.6
7.5
27.8
27.5
7.9
7.1
Stock Watch
February 08, 2017
Company Name
Reco
CMP
Target
Mkt Cap
Sales ( Čcr )
OPM(%)
EPS (Č)
PER(x)
P/BV(x)
RoE(%)
EV/Sales(x)
(Č)
Price ( Č)
( Č cr )
FY17E FY18E
FY17E
FY18E
FY17E
FY18E
FY17E
FY18E
FY17E
FY18E
FY17E
FY18E
FY17E
FY18E
FMCG
Marico
Accumulate
270
300
34,834
6,430
7,349
18.8
19.5
6.4
7.7
42.2
35.1
12.7
10.7
33.2
32.5
5.2
4.5
Nestle*
Neutral
6,155
-
59,348
10,073
11,807
20.7
21.5
124.8
154.2
49.3
39.9
20.3
18.2
34.8
36.7
5.7
4.8
Tata Global
Neutral
142
-
8,940
8,675
9,088
9.8
9.8
7.4
8.2
19.1
17.3
2.2
2.1
7.9
8.1
1.0
0.9
Procter & Gamble
Accumulate
6,950
7,369
22,560
2,939
3,342
23.2
23.0
146.2
163.7
47.5
42.5
106.4
102.1
25.3
23.5
7.2
6.3
Hygiene
IT
HCL Tech^
Buy
815
1,000
114,977
49,242
57,168
20.5
20.5
55.7
64.1
14.6
12.7
3.0
2.3
20.3
17.9
2.2
1.8
Infosys
Buy
945
1,249
217,004
68,350
77,326
27.0
27.0
62.5
69.4
15.1
13.6
3.2
2.9
21.3
21.6
2.6
2.3
TCS
Buy
2,245
2,620
442,322
119,025
133,308
27.6
27.6
131.2
145.5
17.1
15.4
5.5
5.1
32.4
33.1
3.5
3.1
Tech Mahindra
Buy
471
600
45,834
29,673
32,937
15.5
17.0
32.8
39.9
14.4
11.8
2.8
2.4
19.6
20.7
1.3
1.1
Wipro
Buy
458
583
111,225
55,440
60,430
18.1
18.1
36.1
38.9
12.7
11.8
2.3
2.1
19.0
17.6
1.7
1.5
Media
D B Corp
Neutral
380
-
6,992
2,297
2,590
27.4
28.2
21.0
23.4
18.1
16.3
4.2
3.7
23.7
23.1
2.8
2.5
HT Media
Neutral
82
-
1,910
2,693
2,991
12.6
12.9
7.9
9.0
10.4
9.1
0.9
0.8
7.8
8.3
0.3
0.2
Jagran Prakashan
Buy
188
225
6,149
2,355
2,635
28.0
28.0
10.8
12.5
17.4
15.1
3.8
3.3
21.7
21.7
2.6
2.3
Sun TV Network
Neutral
694
-
27,353
2,850
3,265
70.1
71.0
26.2
30.4
26.5
22.8
6.8
6.0
24.3
25.6
9.2
7.9
Hindustan Media
Neutral
275
-
2,019
1,016
1,138
24.3
25.2
27.3
30.1
10.1
9.1
1.9
1.7
16.2
15.8
1.3
1.1
Ventures
TV Today Network
Buy
273
385
1,626
637
743
27.5
27.5
18.4
21.4
14.8
12.8
2.6
2.2
17.4
17.2
2.2
1.8
Metals & Mining
Coal India
Neutral
316
-
195,906
84,638
94,297
21.4
22.3
24.5
27.1
12.9
11.7
5.4
5.1
42.6
46.0
1.8
1.6
Hind. Zinc
Neutral
311
-
131,407
14,252
18,465
55.9
48.3
15.8
21.5
19.7
14.5
3.2
2.8
17.0
20.7
9.2
7.1
Hindalco
Neutral
186
-
38,420
107,899
112,095
7.4
8.2
9.2
13.0
20.2
14.3
1.0
0.9
4.8
6.6
0.9
0.8
JSW Steel
Neutral
189
-
45,698
53,201
58,779
16.1
16.2
130.6
153.7
1.5
1.2
0.2
0.2
14.0
14.4
1.6
1.4
NMDC
Neutral
147
-
46,367
6,643
7,284
44.4
47.7
7.1
7.7
20.6
19.0
1.8
1.7
8.8
9.2
4.7
4.3
SAIL
Neutral
66
-
27,383
47,528
53,738
(0.7)
2.1
(1.9)
2.6
25.5
0.7
0.7
(1.6)
3.9
1.4
1.3
Vedanta
Neutral
248
-
73,539
71,744
81,944
19.2
21.7
13.4
20.1
18.5
12.3
1.6
1.4
8.4
11.3
1.4
1.1
Tata Steel
Neutral
473
-
45,963
121,374
121,856
7.2
8.4
18.6
34.3
25.4
13.8
1.6
1.5
6.1
10.1
1.0
1.0
Oil & Gas
Cairn India
Neutral
273
-
51,117
9,127
10,632
4.3
20.6
8.8
11.7
31.0
23.3
1.0
1.0
3.3
4.2
7.1
5.9
GAIL
Neutral
476
-
60,424
56,220
65,198
9.3
10.1
27.1
33.3
17.6
14.3
1.6
1.5
9.3
10.7
1.3
1.1
ONGC
Neutral
193
-
248,067
137,222
152,563
15.0
21.8
19.5
24.1
9.9
8.0
0.9
0.8
8.5
10.1
2.1
1.9
Indian Oil Corp
Neutral
392
-
190,230
373,359
428,656
5.9
5.5
54.0
59.3
7.3
6.6
1.1
1.0
16.0
15.6
0.7
0.6
Reliance Industries
Neutral
1,031
-
334,317
301,963
358,039
12.1
12.6
87.7
101.7
11.8
10.1
1.2
1.1
10.7
11.3
1.6
1.3
Pharmaceuticals
Alembic Pharma
Neutral
556
-
10,490
3,483
4,083
20.2
21.4
24.3
30.4
22.9
18.3
5.2
4.2
25.5
25.3
3.0
2.4
Stock Watch
February 08, 2017
Company Name
Reco
CMP
Target
Mkt Cap
Sales ( Čcr )
OPM(%)
EPS (Č)
PER(x)
P/BV(x)
RoE(%)
EV/Sales(x)
(Č)
Price ( Č)
( Č cr )
FY17E
FY18E
FY17E
FY18E
FY17E
FY18E
FY17E
FY18E
FY17E
FY18E
FY17E
FY18E
FY17E
FY18E
Pharmaceuticals
Alkem Laboratories Ltd
Accumulate
1,816
1,989
21,713
6,043
6,893
18.7
19.3
80.5
88.8
22.6
20.5
5.0
4.2
22.3
20.3
3.5
3.0
Aurobindo Pharma
Buy
700
877
40,965
15,720
18,078
23.7
23.7
41.4
47.3
16.9
14.8
4.4
3.4
29.6
26.1
2.8
2.5
Aventis*
Neutral
4,099
-
9,439
2,277
2,597
17.3
18.3
149.4
172.0
27.4
23.8
4.5
3.7
25.1
28.8
3.8
3.1
Cadila Healthcare
Accumulate
367
400
37,607
10,429
12,318
22.6
22.0
16.9
19.2
21.7
19.1
5.5
4.4
28.5
25.7
3.6
3.0
Cipla
Sell
597
490
48,048
15,378
18,089
17.4
18.4
21.6
27.2
27.7
22.0
3.6
3.1
13.7
15.2
3.3
2.8
Dr Reddy's
Neutral
3,064
-
50,760
16,043
18,119
20.8
22.4
112.4
142.9
27.3
21.4
3.6
3.2
14.1
15.9
3.1
2.8
Dishman Pharma
Neutral
233
-
3,752
1,718
1,890
22.7
22.8
9.5
11.3
24.5
20.6
2.4
2.1
10.1
10.9
2.6
2.3
GSK Pharma*
Neutral
2,731
-
23,133
3,000
3,312
15.4
20.6
46.5
60.8
58.7
44.9
14.1
14.1
26.3
30.6
7.4
6.8
Indoco Remedies
Reduce
267
240
2,458
1,112
1,289
16.2
18.2
11.6
16.0
23.0
16.7
3.7
3.1
17.0
20.1
2.3
2.0
Ipca labs
Buy
526
613
6,633
3,303
3,799
15.3
15.3
17.3
19.7
30.4
26.7
2.6
2.4
9.1
9.4
2.1
1.9
Lupin
Buy
1,468
1,809
66,285
15,912
18,644
26.4
26.7
58.1
69.3
25.3
21.2
4.9
4.0
21.4
20.9
4.2
3.5
Sun Pharma
Buy
670
847
160,639
31,129
35,258
32.0
32.9
30.2
35.3
22.2
19.0
3.6
3.0
20.0
20.1
4.7
4.0
Power
Tata Power
Neutral
81
-
21,963
36,916
39,557
17.4
27.1
5.1
6.3
15.9
12.9
1.4
1.3
9.0
10.3
1.6
1.4
NTPC
Neutral
173
-
142,894
86,605
95,545
17.5
20.8
11.8
13.4
14.7
12.9
1.5
1.4
10.5
11.1
3.0
3.0
Power Grid
Accumulate
200
223
104,815
25,315
29,193
88.2
88.7
14.2
17.2
14.2
11.7
2.2
1.9
15.2
16.1
8.8
7.9
Real Estate
Prestige Estate
Buy
170
210
6,390
4,707
5,105
25.2
26.0
10.3
13.0
16.5
13.1
1.3
1.2
10.3
10.2
2.5
2.2
MLIFE
Buy
352
522
1,446
1,152
1,300
22.7
24.6
29.9
35.8
11.8
9.8
0.9
0.8
7.6
8.6
2.0
1.6
Telecom
Bharti Airtel
Neutral
352
-
140,768
105,086
114,808
34.5
34.7
12.2
16.4
28.9
21.5
2.0
1.8
6.8
8.4
2.3
2.0
Idea Cellular
Neutral
107
-
38,660
40,133
43,731
37.2
37.1
6.4
6.5
16.8
16.5
1.4
1.3
8.2
7.6
2.0
1.7
zOthers
Abbott India
Neutral
4,627
-
9,833
3,153
3,583
14.1
14.4
152.2
182.7
30.4
25.3
149.3
127.5
25.6
26.1
2.8
2.4
Asian Granito
Buy
273
351
823
1,060
1,169
12.2
12.5
12.7
15.9
21.6
17.2
2.1
1.8
9.5
10.7
1.1
0.9
Bajaj Electricals
Accumulate
250
274
2,531
4,801
5,351
5.7
6.2
10.4
13.7
24.0
18.3
3.0
2.6
12.4
14.5
0.5
0.5
Banco Products (India)
Neutral
200
-
1,431
1,353
1,471
12.3
12.4
14.5
16.3
13.8
12.3
19.1
17.2
14.5
14.6
1.0
107.0
Coffee Day Enterprises
Neutral
199
-
4,100
2,964
3,260
20.5
21.2
4.7
8.0
-
24.9
2.3
2.1
5.5
8.5
1.8
1.6
Ltd
Competent Automobiles Neutral
174
-
107
1,137
1,256
3.1
2.7
28.0
23.6
6.2
7.4
33.4
30.2
14.3
11.5
0.1
0.1
Elecon Engineering
Neutral
58
-
655
1,482
1,660
13.7
14.5
3.9
5.8
15.0
10.1
3.5
3.2
7.8
10.9
0.8
0.7
Finolex Cables
Neutral
453
-
6,922
2,883
3,115
12.0
12.1
14.2
18.6
31.9
24.3
17.0
14.8
15.8
14.6
2.1
1.9
Garware Wall Ropes
Neutral
629
-
1,376
873
938
14.3
14.3
35.2
37.5
17.9
16.8
3.1
2.7
17.5
15.9
1.5
1.4
Goodyear India*
Neutral
714
-
1,648
1,598
1,704
10.4
10.2
49.4
52.6
14.5
13.6
66.8
58.6
18.2
17.0
0.7
99.5
Stock Watch
February 08, 2017
Company Name
Reco
CMP
Target
Mkt Cap
Sales ( Čcr )
OPM(%)
EPS (Č)
PER(x)
P/BV(x)
RoE(%)
EV/Sales(x)
(Č)
Price ( Č)
( Č cr )
FY17E
FY18E
FY17E
FY18E
FY17E
FY18E
FY17E
FY18E
FY17E
FY18E
FY17E
FY18E
FY17E
FY18E
zOthers
Hitachi
Neutral
1,410
-
3,834
2,081
2,433
8.8
8.9
33.4
39.9
42.2
35.3
34.1
28.4
22.1
21.4
1.8
1.5
HSIL
Neutral
286
-
2,070
2,384
2,515
15.8
16.3
15.3
19.4
18.7
14.8
18.6
16.0
7.8
9.3
1.0
0.9
Interglobe Aviation
Neutral
848
-
30,660
21,122
26,005
14.5
27.6
110.7
132.1
7.7
6.4
45.9
32.8
168.5
201.1
1.4
1.1
Jyothy Laboratories
Neutral
348
-
6,315
1,440
2,052
11.5
13.0
8.5
10.0
40.9
34.8
9.9
9.2
18.6
19.3
4.7
3.3
Kirloskar Engines India
Neutral
345
-
4,991
2,554
2,800
9.9
10.0
10.5
12.1
32.9
28.5
13.8
13.0
10.7
11.7
1.6
1.4
Ltd
Linc Pen & Plastics
Neutral
256
-
379
382
420
9.3
9.5
13.5
15.7
19.0
16.3
3.3
2.8
17.1
17.3
1.1
0.9
M M Forgings
Neutral
489
-
590
546
608
20.4
20.7
41.3
48.7
11.9
10.0
67.0
59.3
16.6
17.0
0.9
0.8
Manpasand Bever.
Neutral
690
-
3,946
836
1,087
19.6
19.4
16.9
23.8
40.8
29.0
4.9
4.3
12.0
14.8
4.5
3.3
Mirza International
Accumulate
94
107
1,130
1,024
1,148
18.0
18.0
6.9
8.0
13.6
11.7
2.3
1.9
16.6
16.3
1.3
1.2
MT Educare
Neutral
128
-
511
366
417
17.7
18.2
9.4
10.8
13.7
11.9
3.0
2.6
22.2
22.3
1.3
1.1
Narayana Hrudaya
Neutral
325
-
6,646
1,873
2,166
11.5
11.7
2.6
4.0
123.0
82.0
7.5
6.8
6.1
8.3
3.6
3.1
Navkar Corporation
Buy
175
265
2,494
369
561
42.9
42.3
7.2
11.5
24.2
15.2
1.8
1.6
7.4
10.5
7.8
5.1
Navneet Education
Neutral
131
-
3,054
1,062
1,147
24.0
24.0
6.1
6.6
21.5
19.7
4.4
3.9
20.6
19.8
3.0
2.7
Nilkamal
Neutral
1,676
-
2,501
1,995
2,165
10.7
10.4
69.8
80.6
24.0
20.8
95.8
83.2
16.6
16.5
1.2
1.1
Page Industries
Neutral
14,327
-
15,980
2,450
3,124
20.1
17.6
299.0
310.0
47.9
46.2
319.1
243.6
47.1
87.5
6.6
5.2
Parag Milk Foods
Neutral
273
-
2,300
1,919
2,231
9.3
9.6
9.5
12.9
29.0
21.1
4.5
3.7
15.5
17.5
1.4
1.2
Quick Heal
Neutral
262
-
1,833
408
495
27.3
27.0
7.7
8.8
33.8
29.7
3.1
3.1
9.3
10.6
3.6
3.0
Radico Khaitan
Accumulate
128
147
1,708
1,667
1,824
13.0
13.2
6.7
8.2
19.3
15.7
1.7
1.6
9.0
10.2
1.4
1.3
Relaxo Footwears
Neutral
439
-
5,277
2,085
2,469
9.2
8.2
7.6
8.0
58.1
55.3
22.5
19.2
17.9
18.8
2.6
2.2
S H Kelkar & Co.
Neutral
313
-
4,530
1,036
1,160
15.1
15.0
6.1
7.2
51.3
43.6
5.5
5.0
10.7
11.5
4.2
3.8
Siyaram Silk Mills
Accumulate
1,608
1,720
1,507
1,652
1,857
11.6
11.7
92.4
110.1
17.4
14.6
2.6
2.2
14.7
15.2
1.1
1.0
Styrolution ABS India*
Neutral
643
-
1,131
1,440
1,537
9.2
9.0
40.6
42.6
15.8
15.1
40.4
36.8
12.3
11.6
0.7
0.7
Surya Roshni
Neutral
191
-
836
3,342
3,625
7.8
7.5
17.3
19.8
11.0
9.7
21.0
16.8
10.5
10.8
0.5
0.5
Team Lease Serv.
Neutral
927
-
1,584
3,229
4,001
1.5
1.8
22.8
32.8
40.7
28.2
4.4
3.8
10.7
13.4
0.4
0.3
The Byke Hospitality
Neutral
161
-
644
287
384
20.5
20.5
7.6
10.7
21.1
15.0
4.4
3.6
20.7
23.5
2.3
1.7
Transport Corporation of
Neutral
192
-
1,469
2,671
2,911
8.5
8.8
13.9
15.7
13.9
12.3
1.9
1.7
13.7
13.8
0.7
0.6
India
TVS Srichakra
Neutral
3,272
-
2,505
2,304
2,614
13.7
13.8
231.1
266.6
14.2
12.3
367.7
289.5
33.9
29.3
1.1
0.9
UFO Moviez
Neutral
418
-
1,155
619
685
33.2
33.4
30.0
34.9
14.0
12.0
1.9
1.7
13.8
13.9
1.6
1.2
Visaka Industries
Neutral
215
-
342
1,051
1,138
10.3
10.4
21.0
23.1
10.2
9.3
27.6
25.8
9.0
9.2
0.6
0.6
Stock Watch
February 08, 2017
Company Name
Reco
CMP
Target Mkt Cap
Sales ( Čcr )
OPM(%)
EPS (Č)
PER(x)
P/BV(x)
RoE(%)
EV/Sales(x)
(Č)
Price ( Č)
( Č cr )
FY17E FY18E FY17E FY18E FY17E FY18E FY17E FY18E FY17E FY18E FY17E FY18E FY17E FY18E
zOthers
VRL Logistics
Neutral
308
-
2,811
1,902
2,119
16.7
16.6
14.6
16.8
21.2
18.3
4.6
4.1
21.9
22.2
1.6
1.4
Wonderla Holidays
Neutral
380
-
2,145
287
355
38.0
40.0
11.3
14.2
33.6
26.7
4.8
4.2
21.4
23.9
7.2
5.8
Source: Company, Angel Research; Note: *December year end; #September year end; &October year end; Price as on February 07, 2017
Market Outlook
February 08, 2017
Research Team Tel: 022 - 39357800
DISCLAIMER
Angel Broking Private Limited (hereinafter referred to as “Angel”) is a registered Member of National Stock Exchange of India
Limited,Bombay Stock Exchange Limited and Metropolitan Stock Exchange Limited. It is also registered as a Depository Participant with
CDSL and Portfolio Manager with SEBI. It also has registration with AMFI as a Mutual Fund Distributor. Angel Broking Private Limited is a
registered entity with SEBI for Research Analyst in terms of SEBI (Research Analyst) Regulations, 2014 vide registration number
INH000000164. Angel or its associates has not been debarred/ suspended by SEBI or any other regulatory authority for accessing
/dealing in securities Market. Angel or its associates/analyst has not received any compensation / managed or
co-managed public offering of securities of the company covered by Analyst during the past twelve months.
This document is solely for the personal information of the recipient, and must not be singularly used as the basis of any investment
decision. Nothing in this document should be construed as investment or financial advice. Each recipient of this document should make
such investigations as they deem necessary to arrive at an independent evaluation of an investment in the securities of the companies
referred to in this document (including the merits and risks involved), and should consult their own advisors to determine the merits and
risks of such an investment.
Reports based on technical and derivative analysis center on studying charts of a stock's price movement, outstanding positions and
trading volume, as opposed to focusing on a company's fundamentals and, as such, may not match with a report on a company's
fundamentals. Investors are advised to refer the Fundamental and Technical Research Reports available on our website to evaluate the
contrary view, if any.
The information in this document has been printed on the basis of publicly available information, internal data and other reliable
sources believed to be true, but we do not represent that it is accurate or complete and it should not be relied on as such, as this
document is for general guidance only. Angel Broking Pvt. Limited or any of its affiliates/ group companies shall not be in any way
responsible for any loss or damage that may arise to any person from any inadvertent error in the information contained in this report.
Angel Broking Pvt. Limited has not independently verified all the information contained within this document. Accordingly, we cannot
testify, nor make any representation or warranty, express or implied, to the accuracy, contents or data contained within this document.
While Angel Broking Pvt. Limited endeavors to update on a reasonable basis the information discussed in this material, there may be
regulatory, compliance, or other reasons that prevent us from doing so.
This document is being supplied to you solely for your information, and its contents, information or data may not be reproduced,
redistributed or passed on, directly or indirectly.
Neither Angel Broking Pvt. Limited, nor its directors, employees or affiliates shall be liable for any loss or damage that may arise from
or in connection with the use of this information.